|
|
Enhance Knowledge
| EnhKnowTM
,
LLC
Technology Brokerage & Royalty Servicing |
|
|
|
|
| |
Business
Communications |
|
|
Restaurants Products Lifecycle Curves on
Re-Opening Economy |
|
Published: September 4, 2020 |
Original Media: This Publication |
|
Updated: None |
 |
Recently it has been determined that many restaurants including ones
that are parts of chains will fold up and literally disappear due to the
change in the life style in the post pandemic economy. Yet restaurants
are an essential part of the economy and hires very many people and as such
is a sector of the economy that needs to helped to survive. The question though
is which ones to help to survive and which ones to let go, reasonably
assured that those ones will invariably fail. This consideration
therefore requires a means of performing viability analysis of each
restaurant that being considered to be saved in order to ascertain the
rationality of throwing money at it to enable it resume operations. Such
analysis almost always starts of with the consideration of the Product
Life Cycle that describes restaurants.
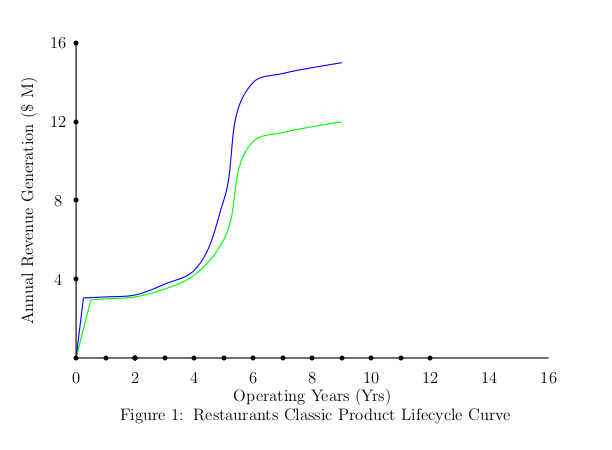
Generally, the Product Lifecycle of a restaurants has the form of Fig.
1, which, for all purposes, has the same form of a Product Lifecycle
Curve but for a near Step Jump to sharp angled gradient Jump, in
aggregate describing an Inception Jump, that displaces the curve upwards
by a certain amount of sales revenue. Also, the |
 |
|
curves generally nearly flattens out as shown, but the relative level of
sales revenues at which they flatten out is unrelated to the evolution
of the Inception Jump, though relate to the Market Allocation for the
specific restaurant with the larger market of its Market Participation.
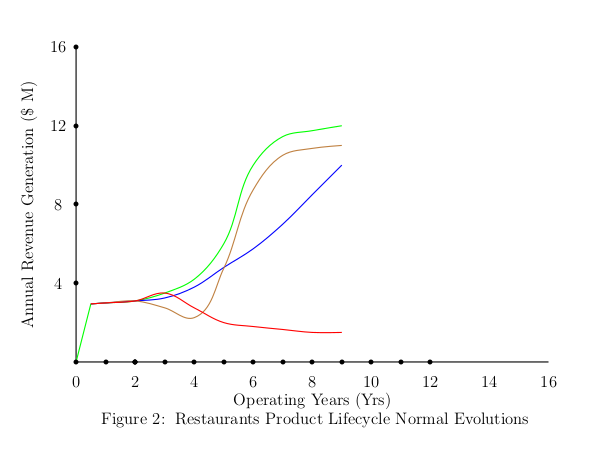
More specifically though, the performance evolution profile of a restaurant
can be of one of the forms as depicted by the curves shown in Fig 2,
with three curves for possible survival and a curve showing a general profile of failure: The three survival possibilities that
characterize restaurants as shown all invariably rise above the
Inception Jump. However, only the three curves reflecting survival would
be representative of Product Lifecycle
Curve of a restaurant. |
 |
|
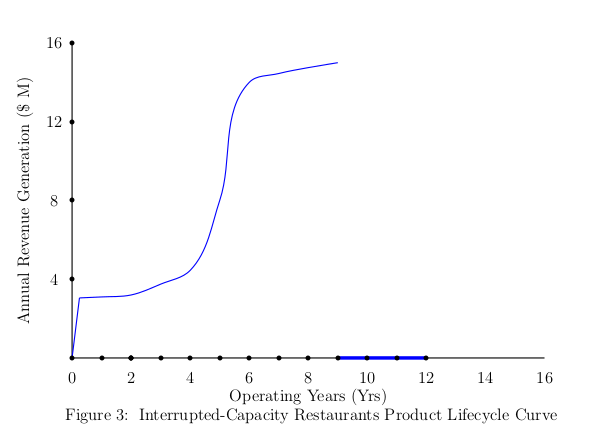
Characterizing the performance of a restaurant in the context of the
disruptions of the pandemic begins the classification of restaurants as of the class of
Interrupted Capacity Profile as defined through characterizations of the
two broad categories of the Pandemic
Company. By that categorization then,
the Product Lifecycle Curve of the pandemic restaurants necessarily has
the form as shown in Fig 3 with |
 |
|
the lifecycle curve suffering a sharp discontinuity with the profile dropping to
the zero reference of sales revenue.
Because the dynamics of a restaurant remains the same, quite
reasonably it could be expected that the Product Lifecycle Curve of the
post pandemic restaurants will have the form akin to the Figs 1 and 2 as
with the pre-pandemic restaurants, but with a much smaller Inception
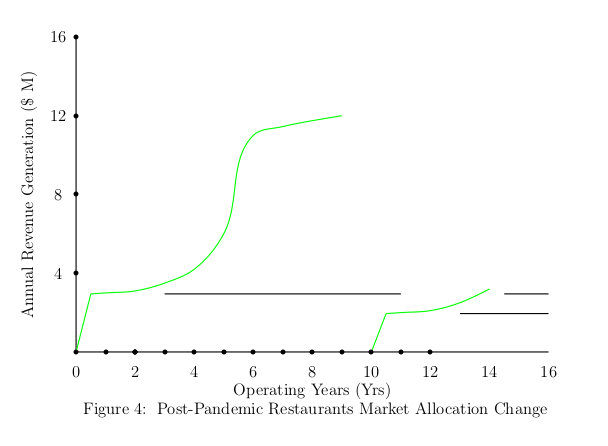
Jump at the reopening of the restaurant, such as is shown in Fig. 4 The
gap between the pair of lines at the lower right bottom of the Fig 4
show the degree of erosion of the Inception Jump, an essential and
stable |
 |
|
support for the survival of a restaurant. The immediate question that
comes up is then this, what is responsible for the drop in the Step
Jump, and does a recovery affect the Product Lifecycle curve.
However,
superposition of the pre-pandemic profile Fig 1 and the reopening
profile -the second of Fig 4, with the time lag rationally collapsed for
better comparison as shown in Fig 5 is more instructive than contrasting
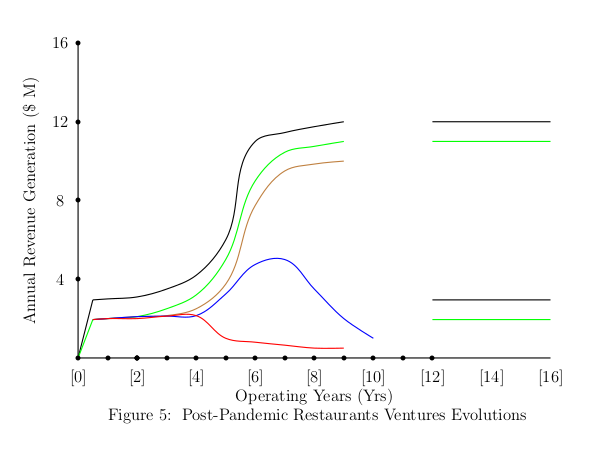
the separate profiles of Fig. 4. Allowing for variants in the evolution
of the post-pandemic restaurants, the analysis must then necessarily
determine the form of Fig 5 a - d Product Lifecycle Curve that would
characterize any given post pandemic |
 |
|
restaurant. Of particular interest in the profiles of Fig. 5 are the
differences between the pair of lines at the top and at the bottom. The
pair of lines at the bottom as in Fig 4 show the degree of erosion of
the Inception Jump, an essential and stable support for the survival of
a restaurant, while the pair at the top reflect the change in the Market
Allocation to the restaurant and therefore the extent of Margin of
Safety available to the restaurant. However, it is the degree of erosion
of the Inception Jump that determines which of the Product Lifecycle
Curves if any prevails. Any prospective forecast of the evolution of a
restaurant, however, must also observe as noted in other posts, that one potentially
surviving form of the Pandemic Company has the construct dubbed Wholistic Corporation,
which has the advantage of seller end-user products and effected
synergistic conglomerate to circumvent issues of pandemic-disrupted
Supply Chains. However, addressing disrupted Supply Chains in any
Wholism Analytics with a restaurant is of such complexity that at best
elicited from the challenges
inherent in the construction of the
viability
analysis datasets, of the Corporation Viability Analytics
for the evaluation of business viability: The fact is that the unit
product case is computed through Supply Chains prevailing.
All these considerations, clearly, suggests that the required
constructions of the datasets, in this context, incorporate into the
analysis the existence of the Supply Chain. Intrinsic in those
constructions of the datasets are two critical factors: The verification
of the production cost of unit product, The due diligence asserting the
inflow of revenue generated in fulfillment of sales order. In any event, satisfying the secondary action for resumption such
that a Pandemic Company is vested with viability from the onset is the
more difficult of the actions to be undertaken for the Pandemic
Restaurant to viably resume operations. and the revenue is computed
through the Buyer Chains prevailing.
This
singular computational
demand to construct viability datasets of verification of
Supply Chains to the end of restarting Interrupted Capacity
Pandemic Restaurant embodies special requirement of
constructed strategic viability designs-set for Stability Analytics within the
Viability Analytics such as is performed with
Business Enduring Viability Analytics and which consequentially must
be adopted in performing Viability Analytics ascertaining the Pandemic
Restaurant Viability. |
|
|
|
|
|
|
|
|